
By Katie Vernoy
Exploring the gaps and challenges in
our country's safety net system
Safety net shortfalls
was created in order to provide critical support during times of economic hardship, and to ensure that individuals' basic needs were met. While we have made great strides over the last century to create programs to help our most vulnerable populations, the system itself carries with it a complexity that makes it difficult for individuals to access the benefits.
The safety net
-Bertolt Brecht
"
The history of the world, my sweet, is who gets eaten and who gets to eat.
Prior to the 1960s, the United States had no official method of gauging who was in poverty. Starting in 1963, the Federal Government set forth to understand individuals' economic status and develop a methodology to assess poverty.
This methodology is central in determining eligibility for safety net programs.
Measuring poverty in the United States
How did we get here?
At the time, there was no official data on the cost of household living expenses and income to measure whether individuals made enough money to afford things like housing, food, shelter, and other essential needs.
The only information available was USDA data on family food budgets,
which showed that families spent about one third of their income on food.
Due to the limited data, the cost of a family food budget became
the key component to calculating what became the Official Poverty Measure.
There's one key metric in defining poverty.
Comparing 1950 to 2022 household spending data, families are spending far less of their income on food today than they were when the poverty measures were first established.
Wondering how much we actually spend on food?
Even though the cost of essential living expenses have fluctuated over time and the portion of income allocated to those essentials has changed, the calculation to determine who is in poverty has remained, with food costs at the center.
10%

Food
13%

Transportation
26%

Housing
Average % of household income spent on food in 2022.
Average % of household income spent on housing in 2022.
Average % of household income spent on transportation in 2022.
While food still makes it into the top three categories of spending (as a percent of income), current housing costs are a much larger portion of spending, followed by transportation, and then food.

2022
10% of income spent on food.


1950
30% of income spent on food.
jump to 2022

Most people spend more on housing than any other expense.
The Federal Poverty Guidelines,
which serve as income thresholds indicating whether an individual is above or below the poverty line, are determined by the Official Poverty Measure.

not considered in poverty & not eligible
in poverty
Poverty income threshold
Individuals above the income threshold are considered not in poverty, and not eligible for safety net benefits.
The income thresholds are differentiated by household size, and fluctuate slightly each year based on the Consumer Price Index.
Looking at the Federal Poverty Guidelines over time
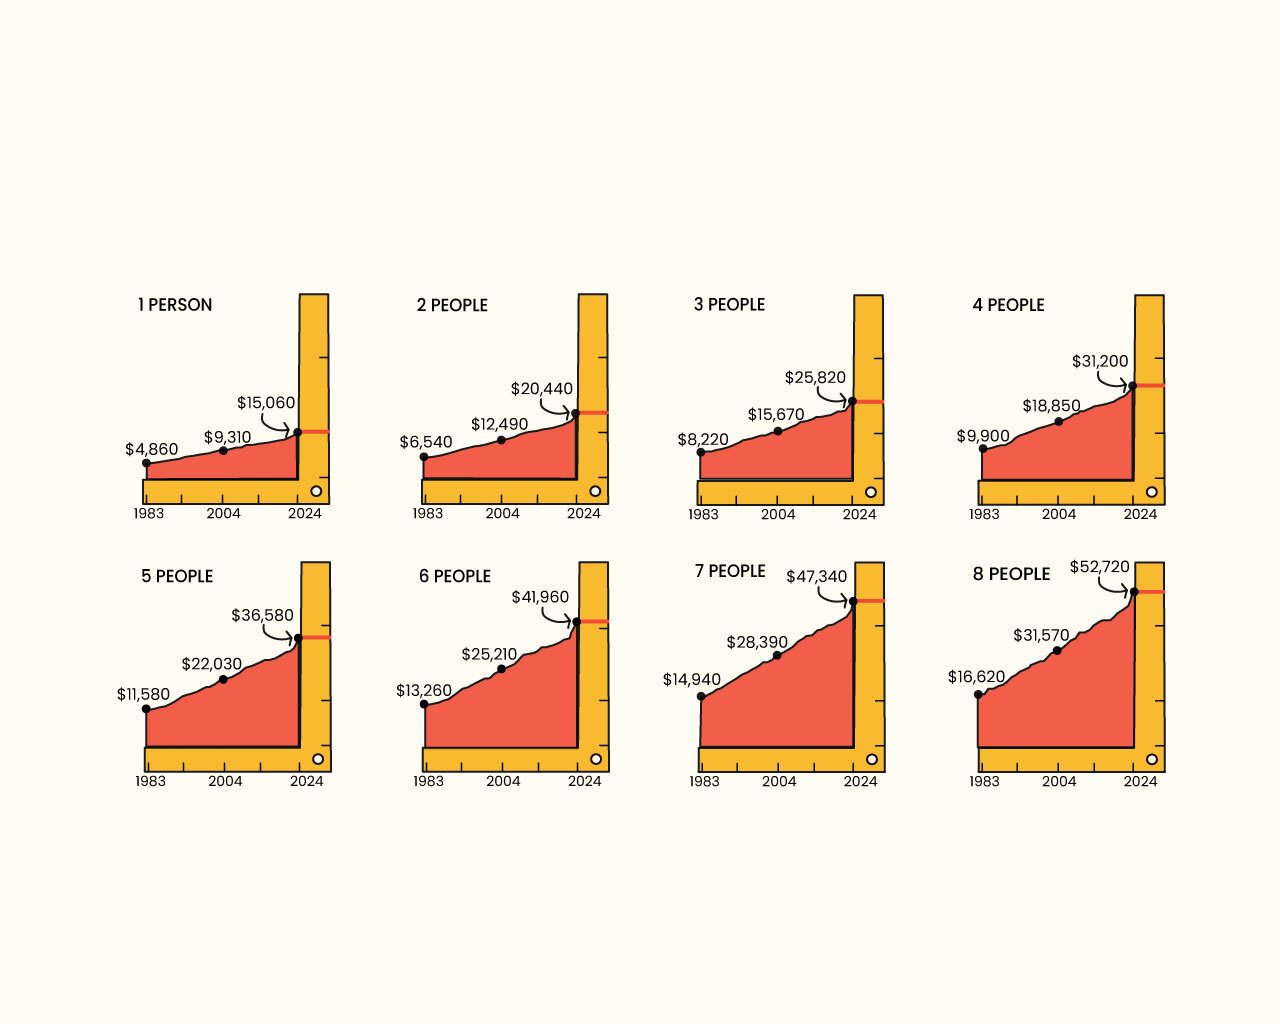
Annual income thresholds used to determine poverty status, 1983 through 2024, by household size
Federal Poverty Guidelines over time

The average American family consists of about three people. Using this family size, let's take a look at how much income is needed to live in the United States.
What does this mean for families facing financial insecurity?
For a family of this size to meet their basic needs, an average annual income of $101,497 is required. This living wage does not account for any extra expenses such as entertainment, and it's important to note that the living wage varies depending on geographic location.
Wondering what a living wage is for your family size and in your community?
CLICK HERE to access the living wage calculator


A living wage
$0
$20,000
$80,000
$100,000
$40,000
$60,000
$101,497
Living wage

Average living wage for a family of three
Comparing the average living wage to the poverty wage
Referring back to the Federal Poverty Guidelines (expressed as an annual wage) that determine eligibility for safety net funding, the government set maximum income threshold for a family of this size is still far lower than what it takes to meet basic needs.
not considered in poverty
in poverty
Given that these thresholds are central in determining eligibility in the various safety net programs, they are too low to cover everyone who is facing financial difficulties.
$0
$20,000
$80,000
$100,000
$40,000
$60,000
Living wage

Poverty wage
$25,820
The Federal Poverty Wage compared to a living wage for a family of three
The "gray area"
To combat this, some programs allow individuals and families to be above the federal poverty wage up to a certain amount.
For example,
For example:
To qualify for SNAP (formerly food stamps) benefits, in some states individuals can earn up to 200% of the federal poverty wage and still qualify.
However, the level of income for eligibility can vary state-by-state and program-by-program, making it confusing for individuals to navigate the process.
$0
$20,000
$80,000
$100,000
$40,000
$60,000
Living wage

The "gray area"
$25,820 -$51,640
The range of income beyond the poverty threshold that may allow for some safety net funding.
Who's being left out?
Given that the federal poverty wages do not account for all essential living expenses, there are likely many individuals who are are classified as 'not poor' by the government's standards, however are struggling to provide a quality life for themselves and their families.

$0
$20,000
$80,000
$100,000
$40,000
$60,000
Living wage

Who's being left out?
Incomes beyond $51,640
Incomes in this range mean this family likely cannot meet their basic needs, but does not qualify for benefits.
Many programs require participants to report any income and household changes. As income fluctuates, individuals who are receiving safety net funds can find themselves in a situation where they are bumped out of the threshold, and have their benefits taken away.
Because of the nature of the system itself, and that each program operates under a different set of rules, individuals utilizing the safety net programs report a severe lack of understanding when benefits are ripped away from them, and are left feeling trapped.
As income fluctuates, many individuals find themselves without benefits.
During some of the most challenging moments in life, many people find it overwhelmingly difficult to access the benefits needed to help lift them from poverty. The system that was built to lift people up, has some feeling pushed even further down.
A complex system
"
It's not a system that's made to [help] people go and be where they need to be and not be on assistance at all. It's to keep the people where they are... and to basically punish people. They say they're not doing it, but that's what they're doing... from the beginning to the end.
A complex system
Mapping government agencies to their respective safety net programs
with nine separate government agencies overseeing the various programs. Each agency has its own application and eligibility process, complicating access to support. Due to the disjointed nature of the system, it can be very difficult for individuals to navigate and understand if they are eligible, and how to apply for benefits.
The safety net system is complex and fragmented,
Some are reporting challenges in getting the help needed from program staff.
In a recent survey, individuals were asked if they were able to get the help they needed when applying for various safety net programs, as well as whether they were treated with respect. A startling amount reported not receiving the proper assistance or respect, with the highest percent reporting negative experiences when applying for Unemployment and TANF benefits.

Percent of individuals reporting never or sometimes being given the information or help needed from program staff when applying for safety net programs
Medicaid/CHIP
SNAP
SSDI
Rental assistance
SSI
Unemployment insurance
TANF/Cash assistance
19%
25%
21%
23%
24%
45%
39%

Percent of individuals reporting not being treated with courtesy or respsect from program staff when applying for safety net programs, listed by program
Medicaid/CHIP
SNAP
SSDI
Rental assistance
SSI
Unemployment insurance
TANF/Cash assistance
18%
20%
20%
24%
25%
38%
41%
It's experiences like these that make people skeptical that the programs created were truly meant to help people.
If disjointed systems and confusing eligibility and application processes didn't exist, people would likely find it easier to access the benefits, and our social safety net systems could more effectively support those in need.
Is there a better way?
"
It pulls you and weighs you down...They’ll tell you one thing. ‘You need to bring this. You need to bring that.’ Then [after you bring it] ‘oh, this aint enough. You need to go back and get this, and go back and get that.
Percent in poverty reduction if individuals had full access to safety net benefits they were eligible for
You can hover over and click on each state for more info.

Hawaii would have the largest percent reduction in poverty, follwed by California.
Some states would have an even more dramatic percent reduction in poverty with barriers removed and getting everyone the access and funds they need.
A recent analysis conducted by The Urban Institute examined seven key safety net programs (SNAP, SSI, WIC, TANF, CCDF, LIHEAP, and Housing Assistance) to determine how much poverty would decrease if barriers didn't exist, and individuals received full funding.
This analysis was conducted by using a micro simulation model, the Analysis of Transfers, Taxes, and Income Security (ATTIS), in conjunction with the American Community Survey to make a projection based on 2022 funding in order to determine how much individuals are accessing in safety net benefits compared to what they are eligible for.
Due to the complicated application processes, lack of proper assistance, and stigma around being a part of the system, many people receive significantly less benefits than they are eligible for.
The overall poverty decrease amounts to approximately 14.9 million people who would be able to rise above the poverty level if they were able to have full access to benefits.
The study found that overall, poverty would decrease by 31%, from a poverty percent of
There would be an even greater impact on children with a 44% poverty reduction, from a poverty percent of
to
14.7%
10.1%
to
15.2%
8.5%
Universal Basic Income Programs:
Solutions with no strings attached
How these programs are structured-
Universal
Basic
Income
Everyone in the program receives the benefit (payment).
Payments are enough to
meet basic needs
Continuous and recurring income
Communities across the country are implementing Universal Basic Income pilot programs (also known as Basic Income Programs) to help meet the needs of those facing financial insecurity. Unlike traditional safety net programs, Basic Income programs do not require complex application processes, or offer conditional benefits. Instead, Basic Income programs offer direct cash payments with no strings attached.
A real program in action
In Stockton California, the Stockton Economic Empowerment Demonstration (SEED), implemented a Basic Income Program which gave randomly selected residents $
per month, for a period of two years.

0
Measuring the success >>>
Full-time employment increased among program participants.
personal experience >>>
After one year, the percentage of program recipients employed full-time increased from 28% to 40%.
28%
40%
Because of the flow of unconditional income coming in, individuals were able to more easily search for full-time employment.
"
I think one thing is definitely risk. You can take so much risk. I - there was a time, I - the only reason I believe I got the internship was because of me taking the risk of not - of having to quit a job before and knowing that I have that money. I could sustain myself until this new opportunity came around, and I was able to take it. It was because I kept having to pursue it in the mornings, or I would have to be at work in the mornings. And, if it wasn’t for that money that was like coming in without me really doing anything, I don’t think I would have been able to get the internship.
-SEED Program Participant
More measures of success >>>
Program recipients experienced decreased financial volatility and more ability to pay for unexpected expenses.
mental health improvements >>>
After one year, recipients with the ability to pay for unexpected expenses increased from 25% to 52%.
25%
52%
Because guaranteed income, individuals were better equipped to handle the unexpected.
Besides reduced financial volatility, program participants saw improvements in their mental and emotional well-being.
personal experience >>>
They reported feeling less stressed, depressed, and anxious and were able to focus more on personal health rather than making ends meet.
With an understanding of the United States social safety net system, and knowing the barriers people run into when accessing support, programs like SEED are removing barriers and providing timely access to individuals in times of crisis.
>>>
Finding ways to make a meaningful impact in your community
"
Before SEED came along, I was paying a lot of bills and didn't know how I was gonna eat...
-SEED Program participant
How can we better support and uplift our neighbors, family, and friends in times of crisis?
When individuals are lifted out of poverty, and experience increased financial, emotional, and mental well-being,
entire communities can benefit.
Finding ways to make a meaningful impact in your community.
Sources
Sources listed below in the order displayed within this piece.
Office of the Assistant Secretary for Planning and Evaluation

This is a Capstone project for the MPS in Data Analytics & Visualization program at the Maryland Institute College of Art (MICA).
